VisiWave Site Survey 5.0

A new, major release of VisiWave Site Survey is available right now to assist you in building and maintaining your wireless networks. VisiWave has always been a powerful, yet simple, WiFi site survey tool. Now it's even more powerful, but still straightforward to use.

New Interface for Collecting Survey Data

The user interface for collecting survey data has been completely re-done. While existing customers will still recognize the interface as similar to the previous version, everything was modernized and improved.

Watch the video below to get a glimpse of VisiWave's new data collection interface. In the video, data is collected using both the Continuous and Point-by-Point capture modes, data points are moved and deleted, multiple data points are easily selected, and the floor plan is zoomed and panned.


Play Video for Demonstration of Collecting Survey Data

View Details of All Access Points Seen at Each Data Point

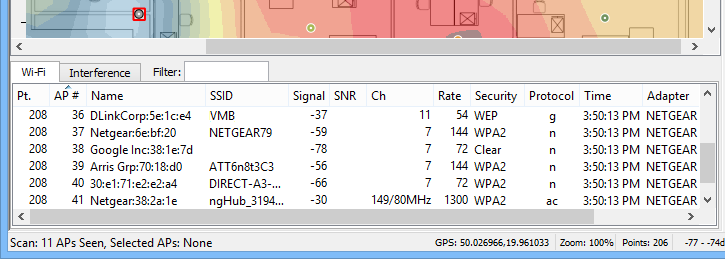
You can view details about each AP seen at every data point. When you select a survey point, a table below the survey map lists all APs seen at that point. When collecting new survey data, the table lists details on all APs seen in the most recent scan. See details such as the AP device manufacturer, signal strength, channel, channel width, protocol, collection time, and wireless adapter used:


Wi-Fi Details Table

Export Survey Data in XML or CSV Format

Do you have some extra analysis you would like to perform on the survey data you collected? Do you want to load the survey results into a different program for viewing the results? Now VisiWave Site Survey gives you the ability to export both the data collected and the values behind some of the views. The data is exported in either the XML format or the Comma Separated Values (CSV) format.

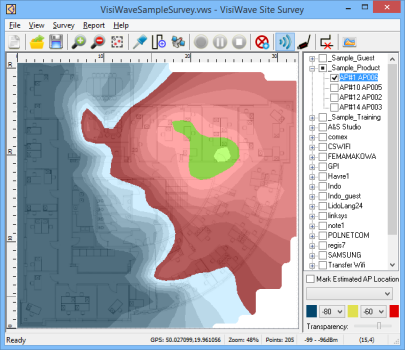
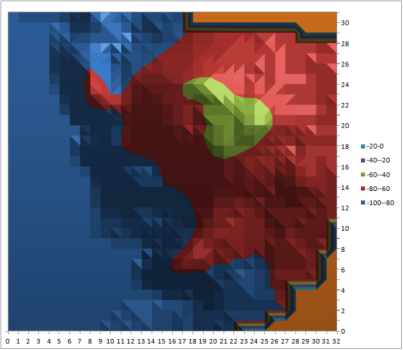
For example, the values used to generate a VisiWave heatmap can be exported as a CSV file and then loaded in Excel to create your own contour surface graph. This example first shows the heatmap in VisiWave and then the same heatmap generated by Excel using the exported CSV heatmap data:


Perform Predictive Surveys (Added v5.0.8)

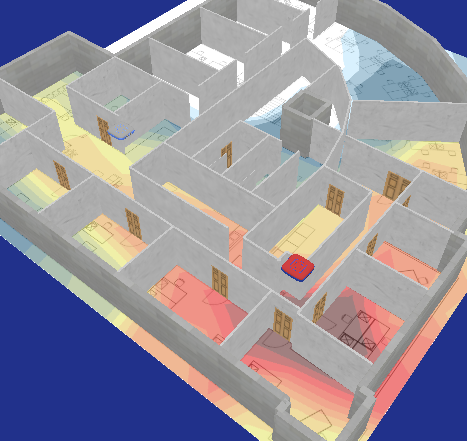
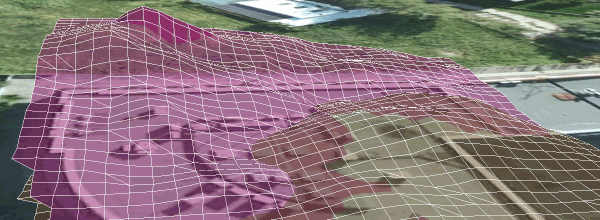
A "Pro" version of VisiWave Site Survey was added with the v5.0.8 release. For those that have a Pro license, you now have the ability to perform WiFi predictive surveys as well as traditional site surveys. Predictive surveys use a model of the survey area that you create to predict what WiFi coverage will be. You describe the building's structures and access points and VisiWave Pro uses a mathematical model to predict the resulting real world coverage.


3D Predictive Survey Model
All New Features in v5.0 of VisiWave

Click on a feature to read more, or click here to expand all.

The user interface for collecting survey data has been completely re-done. While existing customers will still recognize the interface as similar to the previous version, everything was modernized and improved. This feature alone is enough to justify the upgrade for owners of previous versions.

You can view details about each AP seen at every data point. When you select a survey point, a table below the survey map lists all APs seen at that point. When collecting new survey data, the table lists details on all APs seen in the most recent scan.

You can export survey data as either an XML file or as a Comma Separated Values (CSV) file. XML files are useful for processing the results using other tools. CSV files are easily loaded into spreadsheet programs (or other tools) for further analysis. You can export details about each data point collected and/or export the data used for various VisiWave reports such as heatmap data, AP Locations, or Overview Statistics.

This version better handles characters from the entire world rather than just the characters from English.

The first half of an Access Point's MAC address consists of the Organizational Unique Identifier (OUI). This indicates the device's manufacturer. The last half is that device's serial number. When showing MAC addresses, VisiWave maps the OUI to a shortened version of the manufacturer's name and follows this with the serial number. This allows you to quickly identify the AP's manufacturer.

You can give each AP your own meaningful name. These names are stored with the survey file data. Additionally, they are added to a master list so when that AP is seen again in a different survey (using the same computer), the same meaningful name is used again.

You can easily use either a laptop's mouse/touchpad or use a touch screen. VisiWave lets you use large icons when using a touch screen. And it supports normal touch screen operations like pinch to zoom or finger gestures to pan the view. And a multi-select tool lets you easily select objects using only a touch screen.

If a survey data point is accidentally collected in the wrong place, you can relocate that data point at any time. This includes moving entire segments of data points, if necessary. And, you can easily delete one or more invalid data points.

When collecting survey data using a tablet without a mouse pointer, you still see visual feedback on where a data point is being added. Also, the feedback indicates when the scan is complete.

Compared to previous versions, when collecting data using Continuous Mode, the location of the automatically placed survey data points is more precise.

All data that is needed by VisiWave is stored in the survey file (.vws). This includes floor plan images and external images used by a report title page or other images/photos included in the report.

Download Free Evaluation

If you aren't currently using VisiWave, it's time to take a second look. The full-featured evaluation version is a simple download and install. Download the evaluation version now.

Upgrade to Version 5.0

If you already own VisiWave, upgrade to the latest version. It's a low-cost upgrade and more than worth it.

About VisiWave

VisiWave has been on the market for over 19 years, is used by over a dozen Fortune 100 companies, and has customers in over 80 countries and almost every US State.


Features Added in Version 4.0

Below is a list of the new features that were added in version 4.0 of VisiWave Site Survey.

Predict Access Point Coverage

Answer "what-if" questions: After performing a wireless survey—even while sitting back at your desk—you can virtually move an access point and have VisiWave predict what the new coverage heat map will be:


A heat map that predicts the coverage if the AP was relocated

VisiWave gives you the ability to see what coverage would be like if you moved an existing AP to a new location. VisiWave models the coverage based on existing measurements and creates a heat map that predicts what coverage would be like with an AP in the new location.

New Chanalyzer Integration

Add a second dimension to your spectrum analysis: With VisiWave you've always been able to create an interference heat map. Or you could use a spectrum analyzer to see the interference at a specific location. Now for the first time, you can map where the interference is occurring and also replay the spectrum data in a real spectrum analyzer. Collect data once then analyze it any time:


View the same spectrum data as a heat map or using Chanalyzer

Google Earth Reports

Embed yourself inside your building or city-wide site survey results. Instead of viewing static, flat survey results, use VisiWave along with Google Earth to interactively visualize your wireless coverage as 3D models overlaid on the earth's surface. Reveal patterns and details of your Wi-Fi network that simply can't be seen in a PDF report:


Automatically create reports as Google Earth overlays
All New Features in v4.0 of VisiWave

Click on a feature to read more, or click here to expand all.

Support for creating reports in Google Earth has been completely re-done. Google Earth reports now sit right next to PDF and HTML as an output type. Just create a report like you always do and then select Google Earth as the report type.

VisiWave can now show you the predicted coverage of an access point by just virtually moving that AP to a new location on the map. You can propose a new location for any AP Marker that is linked to an actual AP. VisiWave then predicts the coverage of that AP in the new location.

Now you get the best of both worlds when it comes to analyzing your area's interference. VisiWave shows you on a map where the interference is happening and Chanalyzer Pro allows you to see the specifics of the type of interference that was recorded during the survey.

After doing a survey with VisiWave where you collected spectrum data using a Wi-Spy device, you can now view the interference within Chanalyzer Pro. VisiWave automatically launches Chanalyzer and tells it to load the spectrum data collected during the survey. You then use all the normal, powerful features of Chanalyzer to examine the spectrum data.

Note, versions of Chanalyzer prior to v5 may not properly load the spectrum data. If this happens, you will need to upgrade to Chanalyzer 5 or later.

802.11ac is now supported. Just plug in a wireless adapter that supports the 11ac standard and VisiWave will use it to record Wi-Fi survey data.

You now have two color scheme choices: Blended and Distinct. Blended is the new scheme that behaves more like the typical temperature heatmaps that are used for weather forecasts. With this method, you still pick three base colors, but VisiWave now smoothly transitions from one color to the next by blending the two neighboring colors. Also, by default, the three base colors are red, yellow, and blue where red indicates strongest and blue indicates weakest. This is also more like typical temperature heatmaps.

The image file used as the floor plan image is now stored within the survey data file. So now you can move a survey file around without having to also move the image file along with it. This also makes it easier to share a survey file with others.

VisiWave can now directly use floor plan images stored as PDF documents. The entire first page of the PDF is used as the background for your survey area.

Surveys that collect a large number of data points and a large number of access points are now processed much faster. VisiWave can easily handle a survey that collects thousands of data points and that contains thousands of unique access points.

Up until now, your survey maps had to have 'north' pointing to the top of the map or they wouldn't work with Google Earth or GPS data collection. Now you use a map with any orientation. You just have to tell VisiWave which direction is north by using the new "Set North" feature.

Now a minimum signal strength (or SNR) can be set for heatmap graphs. Areas that fall below this minimum value are not colored in.

When hovering your mouse pointer over a data point, the value shown is the strongest signal strength from the set of APs selected in the AP List on the right. Previous versions of VisiWave didn't take the AP List into account when picking the value to show.

All Rights Reserved. | Privacy Policy
© Copyright 2003-2024.