VisiWave Site Survey v7.0
A new, major release of VisiWave Site Survey is available right now to assist you in building and maintaining your wireless networks. VisiWave has always been a powerful, yet simple, WiFi site survey tool. Now it's even more powerful, but still straightforward to use.
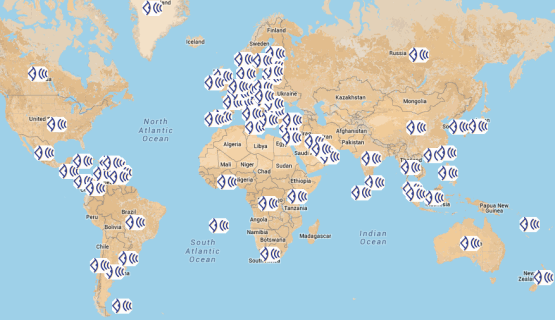
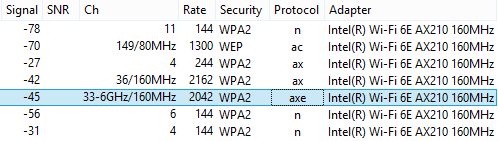
Wi-Fi 6E (6GHz) Support
VisiWave now supports Wi-Fi 6E. This includes capturing and
analyzing the new 6GHz channels. A Wi-Fi 6E capable wireless
adapter is needed as well as Windows 11 (since earlier
versions of Windows do not support Wi-Fi 6E). As long as
you select your Wi-Fi 6E adapter for data collection, the
6GHz channels will also be scanned and included in your
survey.
 Wi-Fi 6E with 6GHz Support
Optimal Radio Placement (Pro only)
VisiWave Pro now has the ability to suggest where you should
place access points when you are doing predictive surveys.
You specify an area's barriers (walls) and tell VisiWave how
many APs you think you need in that survey area and it then
determines its best estimate of where you should install APs.
You can also highlight "priority areas" in the survey area.
For example, an area of desks or tables where many people
often need Wi-Fi could be marked as a priority area.
VisiWave then runs its algorithm putting priority on coverage
in the priority areas.
To find out how to use Optimal Radio Placement, you can watch the available video demo.
Here is an example of the results of VisiWave determining the best location for access points. This survey area has Priority Areas (in green) where the desks are mainly located. The number of APs requested was 5 using the Wi-Fi 6GHz band. The orange AP icons show the suggested locations based on the priority areas and how radio signals propagate through the walls.
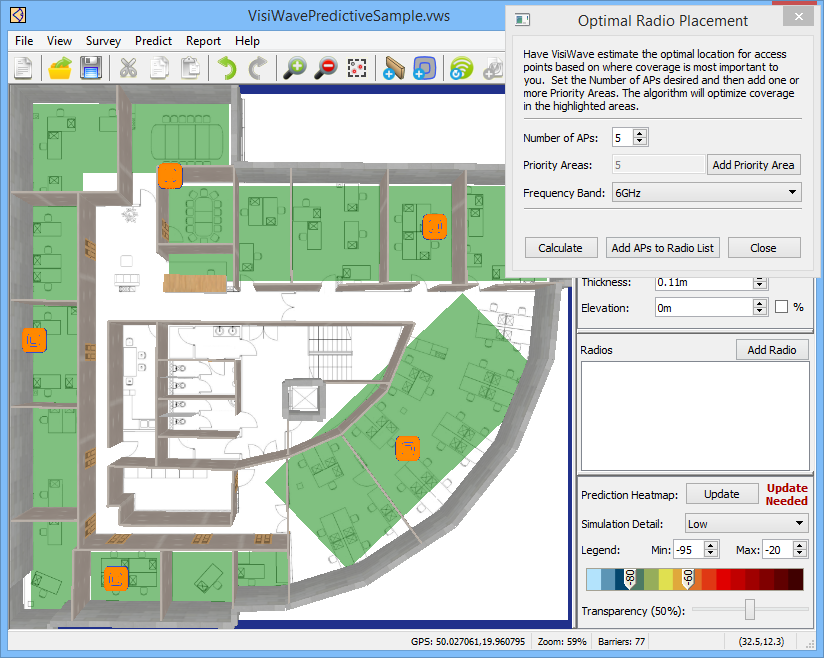 Optimal AP Placements (Orange AP Icons)
Below is the resulting coverage heatmap produced using the suggest AP locations. Note that the priority areas have strong coverage and areas that weren't a priority (the center area and outside the building walls) have medium or poor coverage.
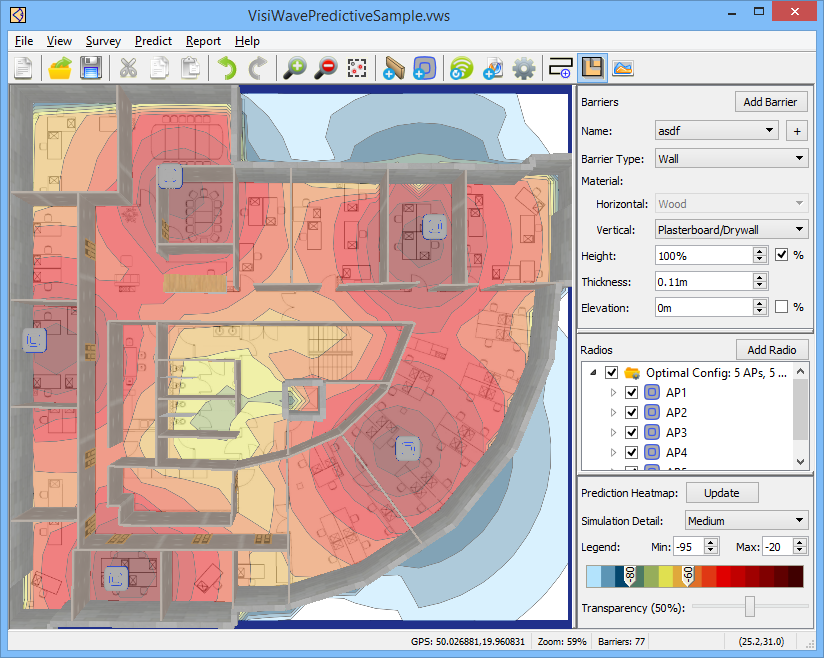 Resulting AP Coverage Heatmap
Crop Survey Area
Instead of having VisiWave use the entire floor plan image
area, you can limit the area where coverage is calculated.
By using the Crop Area feature, VisiWave will concentrate
the heatmap analysis to only the area that you select.
This can make more detailed heatmaps since you can easily
cutout extra space around floor plan images or focus VisiWave
to only look at a subset of the overall survey area.
This works when collecting survey data, in report heatmaps,
and for predictive surveys.
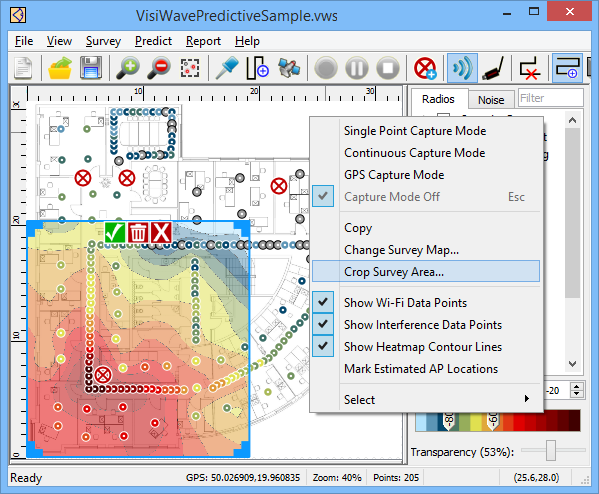 Cropping the Heatmap Area in Survey View
Multi-Select Operations in Predict View (Pro only)
Predict View now supports selecting more than one barrier or
radio. You can then perform an operation on all of the
selected objects at once. For example, you can move a set of
walls, change the walls' material, or delete them. Use the
Shift key and drag your mouse to highlight many items at
once. Or use the Control key to add items to your current
selection.
Improved Simulation Speeds for Predictive Surveys (Pro only)
Simulations done in Predict View are now much faster by taking more advantage of multi-core processors.
Copy Heatmap Image to Clipboard
You can now quickly and easily copy the current heatmap image
to the clipboard so you can paste it into an external
application.
VisiWave v7.0
Download Free Evaluation
If you aren't currently using VisiWave, it's time to take a second look. The full-featured evaluation version is a simple download and install. Download the evaluation version now.
Upgrade to Version 7.0
If you already own VisiWave, upgrade to the latest version. It's a low-cost upgrade and more than worth it.
About VisiWave
VisiWave has been on the market for over 21 years, is used by over a dozen Fortune 100 companies, and has customers in over 80 countries and almost every US State.