A new, major release of VisiWave Site Survey is available right now to assist you in building and maintaining your wireless networks. VisiWave has always been a powerful, yet simple, WiFi site survey tool. Now it's even more powerful, but still straightforward to use.
Organize Several Radios Under One Access Point
VisiWave has always referred to the radios heard during a
site survey as "access points" or "APs". Version 6.0 now
more accurately refers to these simply as "radios". And
allows you to organize several radios under a single
access point. This mirrors the real world were most APs
contain multiple radios.
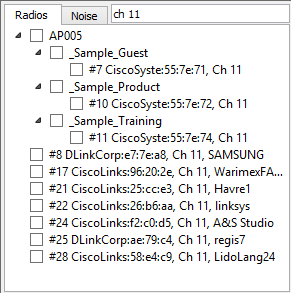
In the AP List and AP Filter, you can now view all the
radios seen grouped in three different ways: SSID, AP,
or radios. The different groupings allow you to
prioritize how you want to work with the list of radios.
Grouping by SSID allows you to easily see all the radios
in a particular network. They are further grouped by
AP name (a custom name you use to identify the access
point). Grouping by AP name allows you to easily work
with all the radios in a particular access point. And
grouping by radios lets you see the complete list of
radios discovered.
Watch the video below to get a glimpse of the new way
VisiWave organizes radios, access points, and SSIDs. Focus
your attention on the AP List on the right side of the
program's window.
Play Video for Demonstration of the new AP List
Searching for Radios in AP List or AP Filter
Both the AP List and AP Filter now allow you to easily
find any item in the lists by providing a filter string.
Enter any identifying substring in the "Filter" field
and only radios/SSIDS/APs that match that substring will
appear in the list.
Find Specific Radios Using AP List Filter
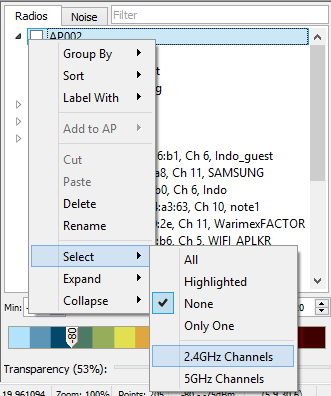
Select Radios by Band in AP List
When creating a heatmap or coverage graph, you can easily
include a set of radios based on which band they use
(2.4GHz or 5GHz). In the AP List or AP Filter, right
click on any SSID or AP and use the "Select" menu to
pick which band you want included. Or select many items
in the list and choose the same "Select" menu.
Select Radios by Frequency Band
Predictive Survey Performance Increase (Pro only)
The simulation engine has been improved to significantly
decrease the time it takes to perform a simulation and
decrease the amount of computer memory needed. The
engine in this release usually more than doubles the
speed and requires only a fraction of the memory for each
simulation. This means you are able to get results faster
and are able to create more complex and realistic
survey area environments.
Improved Predictive Survey Accuracy (Pro only)
The accuracy of predictive surveys has also been improved.
Several small improvements on how radio wave propagation is
model has caused many noticeable improvements in the
predicted results. In particular, thick barriers and
barriers made of metal and concrete better reflect real
world signal propagation.
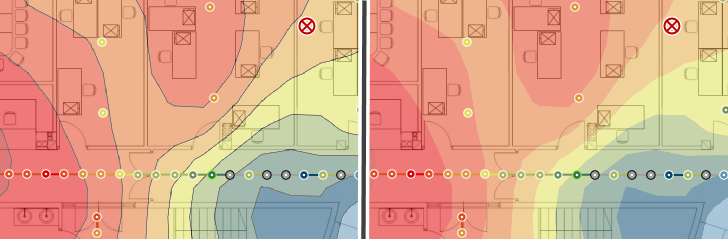
Secondary Coverage Graph
You can now create a heatmap that shows the signal
strength of the second best AP at each location rather
than the strongest. This can be useful by showing what
the coverage would be if any single AP selected in the AP
Filter was to fail. This is available on the Heatmap
Report page by setting the new Secondary Coverage report
property to "Yes".
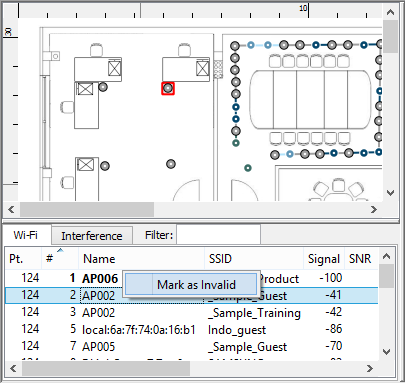
Marking AP Readings as Invalid
Each data point can have many readings representing the
radios heard at that location. Sometimes a wireless
adapter reports a radio reading that is clearly wrong.
Now you can mark these readings as invalid. You do this
in the Wi-Fi Details view that is just below the survey
map. Right click on the AP reading and select "Mark as
Invalid." Then these invalid readings won't be used when
generating heatmaps and coverage graphs.
Mark AP Readings as Invalid
Support for Minimum Signal in Coverage Graphs
Coverage graphs (AP Coverage, Channel Map, and Data Rate Map),
have always supported a minimum SNR, but now they also support
minimum signal strength too. A coverage graph now has a
property named "Minimum Signal." If this value is positive,
then the collected SNR values are used to create the coverage
graph (like before). If this value is negative, then the
collected signal strength values are used.
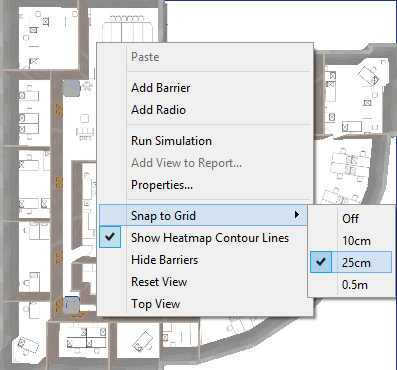
Snap to Grid Support for Predictive Surveys (Pro only)
When adding walls and barriers to describe the survey area
in a predictive survey, you can now enable a
"snap-to-grid" option. This causes all new barriers and
radios to be located on grid boundaries. The grid sizes
can be configured using the pop-up menu when you right-
click on the survey map.
Snap to Grid Options
Heatmap Contour Lines
Heatmaps can now optionally contain lines outlining each
colored contour region. These can be turned on/off either
by right clicking on the background image or by setting
a report item property.
Heatmap Contour Lines (With and Without)
Wi-Fi 6 (802.11ax) Support
VisiWave now supports Wi-Fi 6 or 802.11ax networks. You
will, of course, need to have a wireless adapter that
supports Wi-Fi 6 in order to see these abilities in the
software.
Better Default Filename when Creating Reports
When generating a report in the Report View, the suggested
name is now the same as the survey filename with the proper
extension added. And it defaults to using the same folder
as the survey file.
Predictive Report Images Now Include Color Legend (Pro only)
When adding a predictive heatmap to the report, the report
page's description now includes the total dBm range and the
signal range of each color region of the contour heatmap.
VisiWave v6.0
Download Free Evaluation
If you aren't currently using VisiWave, it's time to take a second look. The full-featured evaluation version is a simple download and install. Download the evaluation version now.
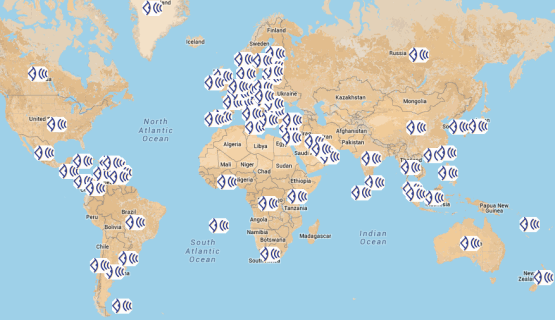
VisiWave has been on the market for over 21 years, is used by over a dozen Fortune 100 companies, and has customers in over 80 countries and almost every US State.