Opening a Traffic File

If you already have a VisiWave Traffic file, you can open it to view the packets. This is done by selecting Open under the File menu or from the toolbar. To get started, you can open the sample Traffic file that ships with the product. This is located in the file called SampleData.vwt located in: Documents->My Wireless Captures->Samples.

Once the Traffic file is loaded, you can press the Play button to view the packets played in real time. Note that VisiWave Traffic can't send the packets from the source station to the destination station in real time since a packet actually travels at the speed of light. VisiWave Traffic instead slows the packet travel down substantially so that you can actually see the packet. The packets are introduced into the scene at their actual transmit time, but the rest of the packet travel time is just VisiWave Traffic's way of animating the process for visualization purposes.

Import Packet Capture File

Another way to get packets into VisiWave Traffic is to import a packet capture file that you already have. VisiWave Traffic supports importing libpcap files, Microsoft Network Monitor files, or PCAP-NG files.

To import an existing capture file, first create a new capture file by selecting New from the File menu or from the toolbar. Then select Import from the File menu. Next, select the existing .pcap, .cap, or .pcapng file. Every packet from the import file will be loaded into a VisiWave Traffic data file. You can now view these packets just like any other VisiWave Traffic file.

Viewing Packets

Once packets are loaded into VisiWave Traffic, they can be viewed in time-order using a 3rd fictional rendering of the packets traveling from their source station to their destination station. VisiWave Traffic only tracks the wireless portion of a network packet's existence. If the packet was originally transmitted over a wired, Ethernet network, that part of the journey is not shown.

Initially, the program is at time zero and no packets are yet traveling in space. To start the timer moving forward, press the Play button in the time line at the bottom of the view. Playback starts in real-time. The position marker advances as time passes. You can press the Pause button to pause playback. You can also grab the position marker with your mouse (or finger on a touch display) to quickly advance to any point in time.

Below the Play button is the playback direction icon. When the arrow points right, time advances going forward. Pressing this button causes time to go in reverse. If the arrow points to the left, time goes backwards toward the beginning.

Below the time line are two sliders. The left one selects the how fast time passes. Setting it to "1x" means time passes as it does in real life. Setting it to "2x" means time passes twice as fast as normal. Setting it to "0.5x" means time passes slowly at half speed. The right slider drives how long it takes for a packet to travel from its source to its destination. This is arbitrarily set to 2 seconds with the default settings (instead of the normal speed-of-light).

Changing Your View

Sometimes you will need to change your view of the packets to better see one area of the floor plan or to zoom in to see more details. This is done using either your mouse or a touch screen.

Using Your Mouse:

You can spin/rotate the scene using the mouse by holding down the left mouse button and moving left or right. You can tilt the scene by moving the mouse up or down. To move the entire scene closer or further away from you or left/right, right click and drag the mouse in the desired direction. To zoom in on the scene, roll your mouse wheel away from you. To zoom out, roll your mouse wheel toward you. The same can sometimes be done using a touchpad by using an up or down gesture on your touchpad with your finger.

Using a Touch Screen:

You can spin/rotate the scene using a touch screen by touching the screen in two places and twisting your fingers in a circular pattern. And to tilt the scene, you also use two fingers but drag them both up or down. To zoom out, use two fingers and pinch the screen. Un-pinch your fingers to zoom in. Moving just one finger around the screen moves the scene.

Filter by Packet Type

You can filter the packets that are shown in the view using one of the three main types of filter found along the right side of the application window. You can filter by Station, Channel, or Packet Type.

To filter by Packet Type, click on the tab on the right labeled "Pkt Types". If you can't see the filters, make sure Show Filters is checked in the View menu. The Packet Type filter lists all the different types of wireless packets that can exist. These are divided up into three groups: Management, Control, and Data packets. Each type has many subtypes. Putting a checkmark next to a subtype means that packets of that subtype will be included in the view. And removing the checkmark means those packets won't be displayed. For example, you may want to turn off Beacon packets since there can be so many of these packets that it makes it difficult to see the other packets that you may be more interested in.

You can also have VisiWave Traffic color each packet type (or subtype) a different color. By right-clicking on the name of the type, you will see a pop-up menu that lists many functions that you can do for that type or the entire list. Under the Packet Color menu, you can change the color for that particular packet type using the first three menu items. Setting the color for the top level packet type means that any packet subtype that doesn't have a specific color assigned to it will show up with this color. For example, setting management packets to blue will make all management packet subtypes as blue unless you override one or more of them. You can also select one of the "Use Standard" menu items. This will make VisiWave Traffic set the colors for each subtype to a predefined list of unique colors.

Using this same pop-up menu, you can choose to expand or collapse all the top level types so you can show/hide all the subtypes. Or you can choose to select all or none of the subtypes. Turning on "Select Only One" is an easy way to quickly switch between showing only a single subtype at a time. In this mode, when you put a checkmark next to a new subtype, all other subtypes are automatically deselected.

Filter by Station

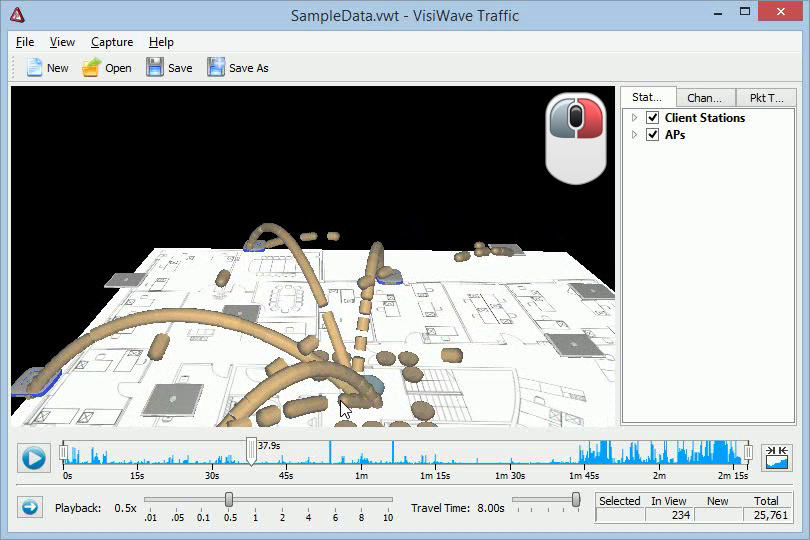
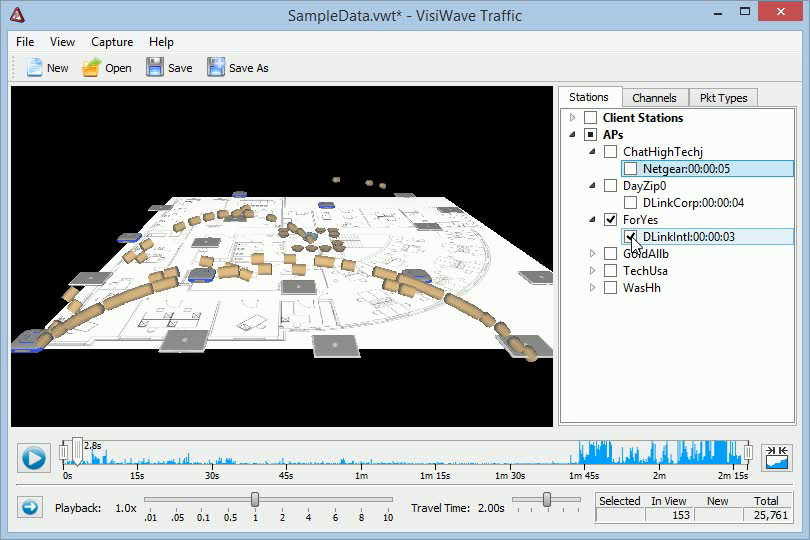
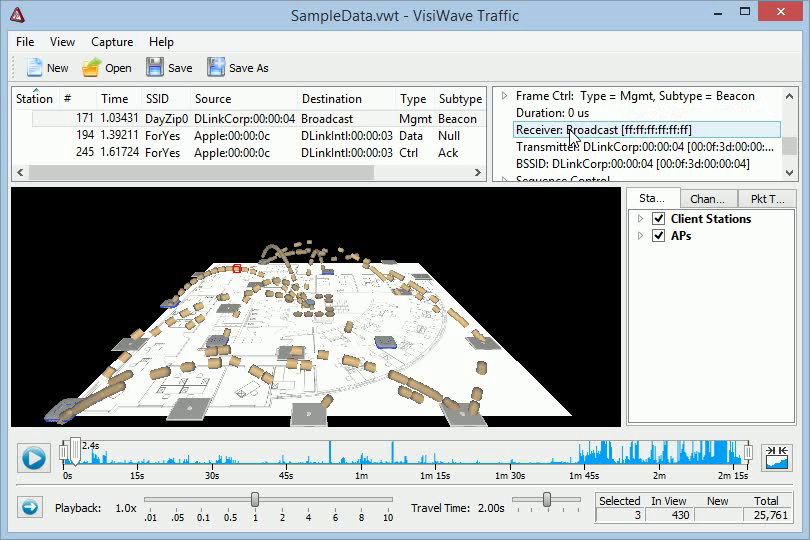
To filter packets by station, click on the tab on the right labeled "Stations". A station is any wireless client, access point, or any other wireless device. Therefore, the Station filter lists all the wireless devices and access points seen at any point during the capture. By default, they are divided up into two main groups: Client Devices and APs. Under Client Devices, every wireless device that was seen that didn't identify as an access point, is listed. Under APs, all the SSIDs discovered are listed. Under each SSIDs, every access point that is part of that SSID is listed.

By putting a checkmark next to a station, you include any packets that either come from that station or are heading to it. So, to remove packets from the view, you usually have to remove both the source and destination of the packets. So, unchecking all clients but leaving all APs checked usually doesn't remove any packets from the view (except maybe client-to-client connections). This is because packets generally travel between one client and one AP and filtering out just the clients doesn't remove the packets because they still have an AP as either their source or destination.

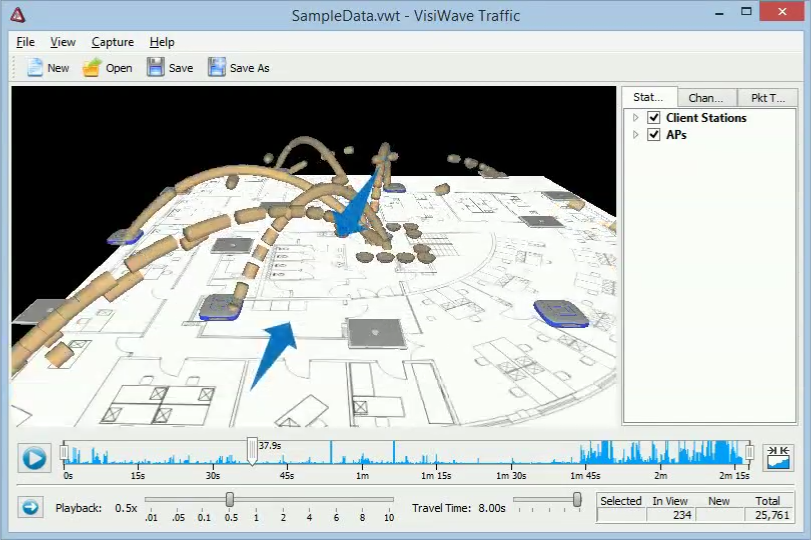
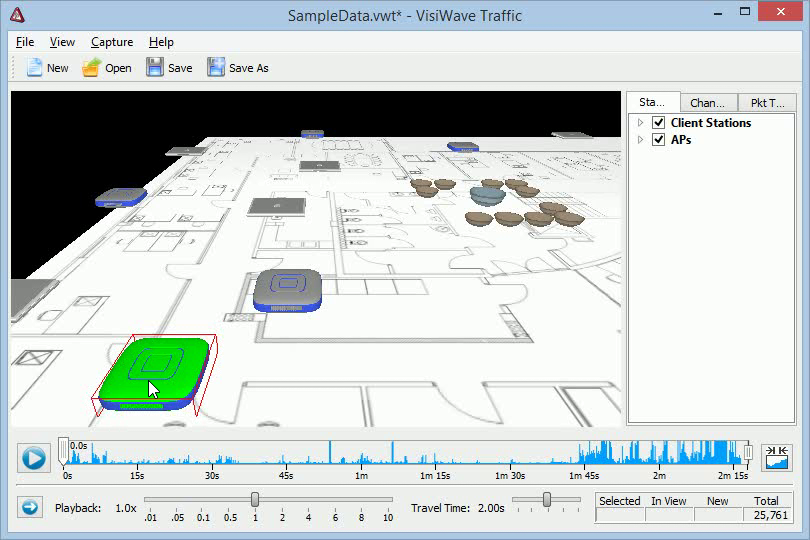
To actually filter traffic based on the station, you should select either a small number of APs or a small number of clients. Then you can focus your attention on just the traffic that you are interested in.

By right-clicking on any station, you bring up a pop-up menu that give you several convenience options and a few options on how to group or sort the stations. If you select "Select Only One", then every time you click on a new station, all the other stations are automatically unchecked. You have a few options on how to sort the stations. And you can have the stations grouped as one long list instead of split up by device type.

Filter by Channel

To filter packets by channel, click on the tab on the right labeled "Channels". All the valid 2.4GHz and 5GHz channels are listed. You can hover over a channel number to see its center frequency and frequency range. Only packets that were transmitted over channels with checkmarks next to them are shown in the view.

Note that capturing traffic on more than one channel at the same time can be challenging since you typically need one wireless adapter per channel being captured and you need capturing software that's able to do this. Using VisiWave Traffic's built-in capturing abilities, you can only capture one channel at a time--although you can cycle through different channels and a single capture file can contain traffic from any number of channels.

Packet List

In addition to just viewing the packet travel from one station to another, you can view many details about every packet in the view. These details are shown at the top of the window by clicking on "Show Packet List" in the View menu. To see details on a specific packet, click on it in the view. The Packet List at the top will list every selected packet. You can select more than one packet by pressing the Control key while clicking on additional packets. Also, you can click on one or more stations to see all the packets going to or coming from that station. Lastly, you can right-click on the floor plan to bring up a pop-up menu that allows you to select all the packets currently in the view.

To sort the list of packets, you can click on the column header that you want to sort by. If you click on "Station" and you have selected more than one station, then the packets are first grouped by the station they are coming from or going to. Under each station, they are ordered by their frame number. Selecting any other column removes the grouping by the station and just creates a single list of sorted packets.

Right-clicking on any packet in the Packet List brings up a pop-up menu that lets you view some or all of the selected packets in an external packet viewer. You just need to have an external program set up to view files with the extension of ".pcap".

Packet Decode

You can view even more details of your wireless traffic by having VisiWave Traffic decode the bits included in each packet. To the right of the Packet List is a pane that displays details about every bit in a wireless packet. If this pane is not visible, you can open it by grabbing the right border and dragging it left. Then, just click on a packet in the Packet List.

In the Decode View, you can see what each byte and bit means inside each packet. You can expand each section you are interested in to see further details. For example, on a Beacon Management Packet, you can scroll down to view all of the Information Elements. Opening up this high level section, further shows the decoded bits that are contains in that element.

Using the Timeline

At the bottom of the window you'll find the timeline that shows both what time you are currently viewing and the entire time history of the current capture. By moving the main marker right, you move from the beginning of the capture to a time later in the capture. Which packets are shown depends on what time is currently selected in the timeline. If you are pointing to 1 minute from the beginning of the capture, then the packets that where captured exactly 1 minute into the capture will just be leaving their source station. Also shown at that time are the locations of the packets that had were just recently transmitted. In real life, these older packets traveled at the speed of light and had already reached their destination before the next packet was sent out, but for visualization purposes, these packets are shown taking a few seconds to arrive at their destination.

The background of the timeline is a histogram that shows the relative number of packets found at each time slice over the course of the entire capture. The higher the blue line is at any point in the timeline, the more packets that were captured at that point in time. This histogram takes into account the packets that were filtered out.

At each edge of the timeline is an extra tab that you can grab and moved toward the center. This allows you to zoom into a smaller range of the overall capture time. So if your capture lasted an hour, you can move these two tabs to zoom into a time frame that only covers a minute or two. This allows you to better control what is shown in the view. To do this, grab the tab on the left and move it right. Then grab the tab on the right and move it left. Then click on the icon to the right of the timeline to zoom in. After doing this, the entire timeline only covers the smaller time range that you just selected. Pressing that icon again zooms you back out to show the entire time frame again.

Pressing down on the main tab or either of the edge tabs shows you the real world time at the tab's current position. The time listed near the top of the main tab shows how far (in time) the tab is from the beginning of the capture.

Setting the Floor Plan

You can use either an image or a solid color as the floor plan for your view. For a new capture file, the floor plan is set to the color white and is square. You can change the floor plan at any time. To change it, right-click on the existing floor plan. Then you can either set it to an image file or pick a solid color.

The supported image formats are: PNG, JPG, GIF, and BMP (Windows bitmap). The shape of the floor plan is determined by the shape of the image. Note that for PNG images, the alpha channel (transparency) is used so you can make a floor plan of any shape by making part of the image transparent. Or you can make the floor plan completely invisible (clear) if you use a small PNG image that has the alpha channel set to invisible for the entire image.

Moving Stations

There are three main types of wireless stations: client devices, access points, and a special device type that represents broadcast packets. Client devices appear as a closed laptop. Access points appear as a generic access point device. The special broadcast device shows up as a bowl in the middle of the floor plan. Packets that are broadcast to all wireless devices that are in range really should appear as packets that go from one station to every other station in the scene. But because broadcast packets are so common and there can be many stations in view, doing it this way would dominate and overwhelm the view. So instead, broadcast packets are visualized by sending them all to one location (represented as a bowl that receives packets). Similar to broadcast packets are multicast packets. These packets are meant for a subset of stations, but still many. Each multicast destination that is seen is also represented as a bowl, but the bowl is smaller.

As new stations are discovered (during an import or during a capture), they are randomly spaced throughout the floor plan. The broadcast device is located at the center of the floor plan and the multicast devices are closely clustered around the center.

To make a more meaningful view of the wireless network, you are encouraged to move at least the access points to where they really exist on the floor plan. You can also move the client station to known locations and you can relocate the broadcast device and all the multicast devices to any other location you would like.

To move any station, right-click on the station and click on "Move". The station will change colors and stay highlighted. Grab the station by left-clicking on it with your mouse (or touch it with your finger) and dragging it to the new location.

Often a single physical access point actually has many different radios in it. Each of these radios will show up as separate access points in the view. You can combine all of these into one single unit by stacking them on top of each other. You do this by dragging one access point and dropping it on top of another. After that, the two access points are treated as a single unit. You can unstack an access point by right-clicking on the stack and selecting its MAC address from the "Remove from Group" menu. Note that you can also do this with client devices or multicast devices, but you can only stack devices of the same type.

Capturing Packets

VisiWave Traffic gives you the ability to easily capture live packets under Windows. To do this, you will need Microsoft Network Monitor v3.4 installed. This can be downloaded from Microsoft's website. You will also need a wireless adapter that supports capturing packets in monitor mode. Not all adapters support this and many that do don't do it well.

Usually you will open a new capture file and set the floor plan before capturing packets. You can capture new packets into an already existing capture file, but there will probably be a big time-gap between the original packets and the newly captured packets.

To capture new packets, first create a new capture file by selecting New from the File menu. Next, you should set the floor plan image, by right-clicking on the background and selecting a new floor plan image. Then go to the Capture menu and select the adapter you want to use to capture. This if found under the Active Adapter submenu. Make note of the name of the adapter in parenthesis. Then select Set Capture Channel from the Capture menu. A new window will pop-up called "WiFi Scanning Options". Select the same adapter next to "Select adapter" that you selected under Active Adapters by matching the name to the name in parenthesis. Next, put a check in the Switch to Monitor Mode box. Then select the channel you are interested in (or pick a set of channels under the Scan option to slowly cycle through many channels). Lastly, click on Apply. The window will not disappear. Do not close this window, just move it to the side. This window needs to stay open as long as you are collecting packets in order to stay on the selected channel.

Now you are ready to select Start Capture from the Capture menu. Packets will immediately start capturing, but there will be a small delay before the timeline shows any packets. You can look under New in the lower right corner to see the number of new packets that have been captured so far. The timeline will automatically update every several seconds. You can press Play to see the packets as they are being captured. Select Stop Capture from the Capture menu when you have collected enough packets. Then save your new capture file.

Exporting Packets

From any existing capture file, you can export packets to the industry standard file format, libpcap (.pcap). You can then use that .pcap file in other tools used to analyze wireless packets.

To export packets, load your capture file then select Export from the File menu. A window will appear that gives you many options for selecting the packets you wish to export. You can simply export all the packets by selecting Export All Packets. To export all packet regardless of the current filters you have set (such as Packet Type filters or Station filters), make sure the Use Filters checkbox is not checked.

To export just the packets you have selected in the Packet List (found just below the menu), select Export Selected Packets.

To export any custom range of packets, select the Custom Range option and then enter the packet number Start Frame and End Frame numbers. To help pick the frame numbers, you can have VisiWave Traffic use the starting and ending frame numbers from the timeline range. This means export the packets in between the left tab and right tab on the timeline. Or you can easily set the Start Frame number to the frame that is currently being displayed in the view.

In each case, the number of packets that will be exported is displayed for your convenience. Press the Export button to provide the name of the new file and to perform the export. After the export file is created, you can re-import the packets into a new capture file by selecting Import from the File menu. This can be helpful if you want to create a new capture file that only contains a smaller range of packets.

All Rights Reserved. | Privacy Policy
© Copyright 2003-2024.